New York City · Co-op Acquisition
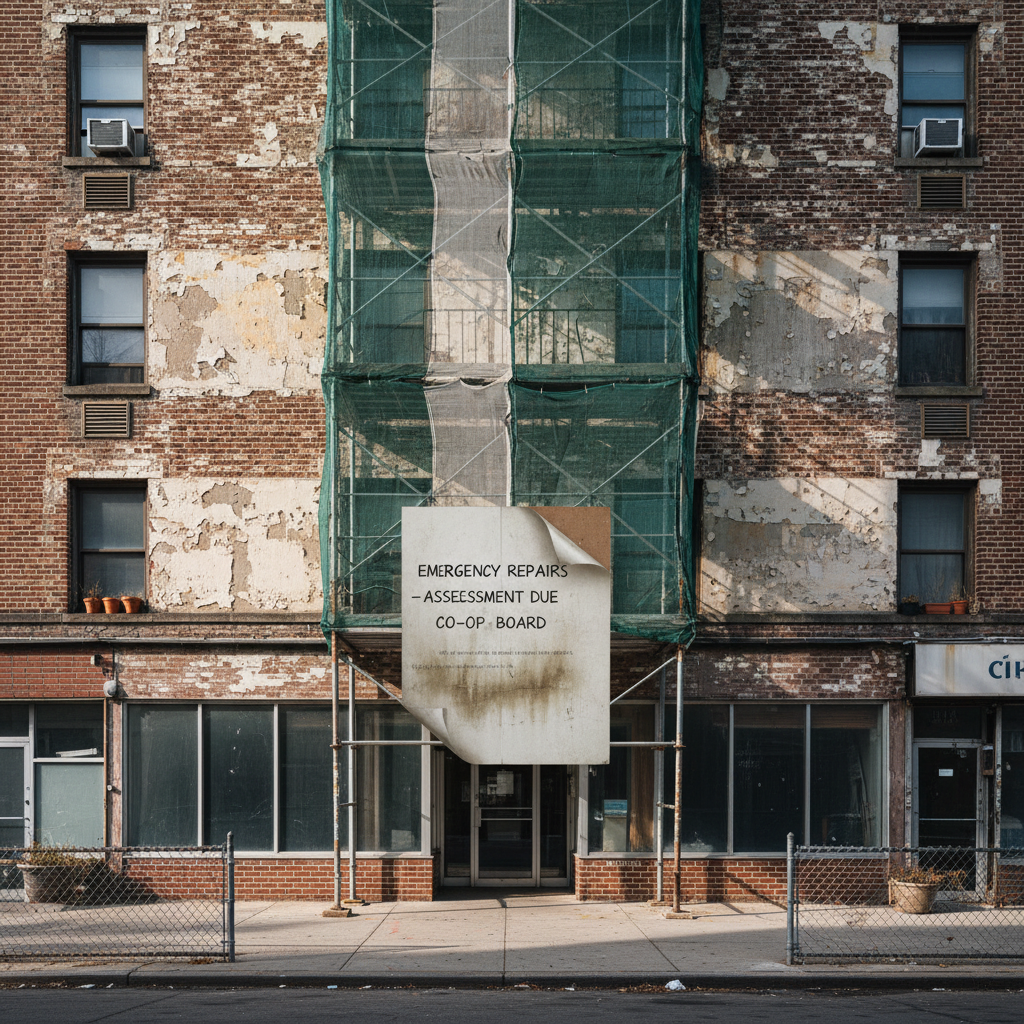
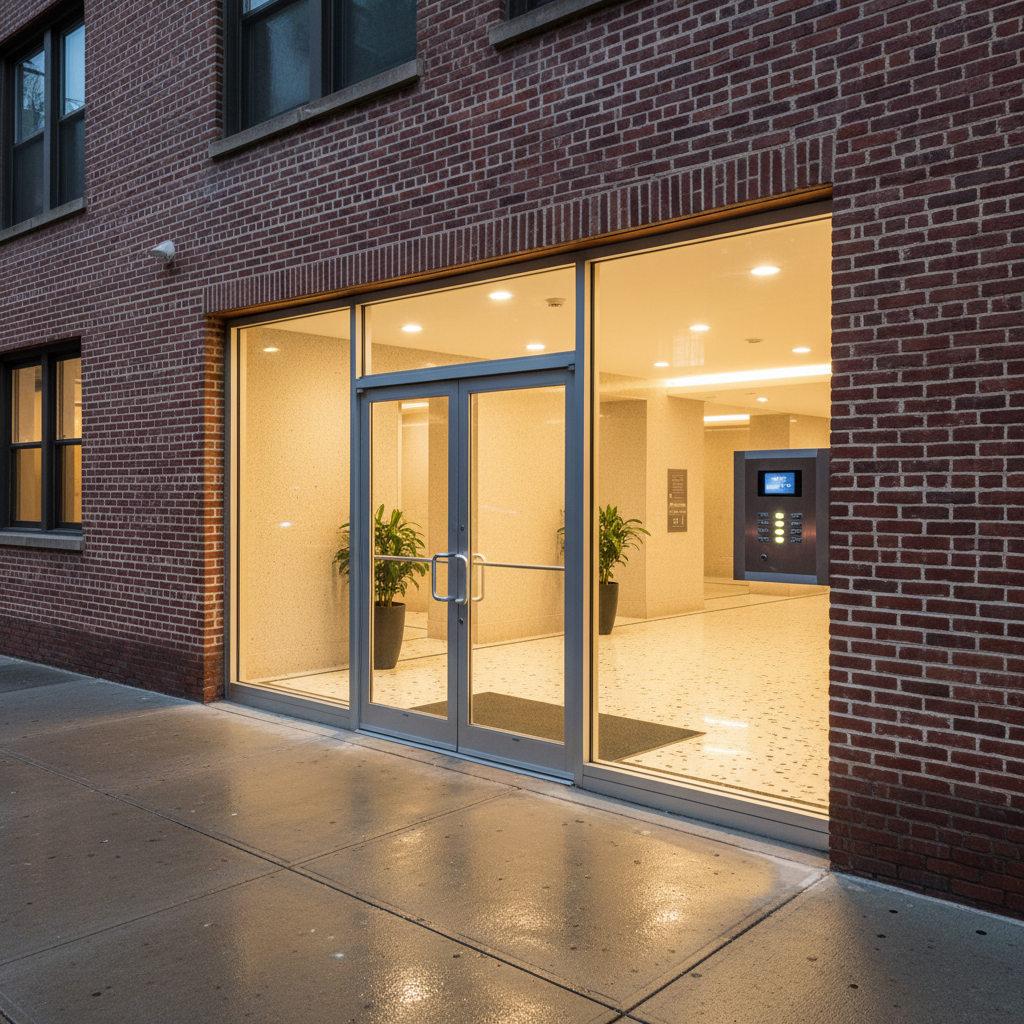
The Deal Is in the Building
Nobody Wants.
Drag to see what we see — and what everyone else walked past.
Live Underwriting Tool
Run the numbers on any
co-op in the city.
Enter three public data points. The model does the rest — cap rate, equity multiple, five-year IRR. No email required.
Find on StreetEasy or the board's offering plan
From the proprietary lease or city tax records
Distressed buildings trade at 40–60% below market
Enter the three inputs on the left to generate your underwriting output.
Projections use stabilized NOI assumptions with a 3% annual growth rate and exit cap rate compression of 150bps. Not investment advice. Past performance of completed deals does not guarantee future results. For accredited investors only.

Washington Heights, Manhattan
1847 Amsterdam Ave

Bushwick, Brooklyn
423 Decatur St
The Strategy
Why the flip tax is the edge nobody talks about.
Board Relationship
Flip Tax Arbitrage
Deferred Maintenance Discount
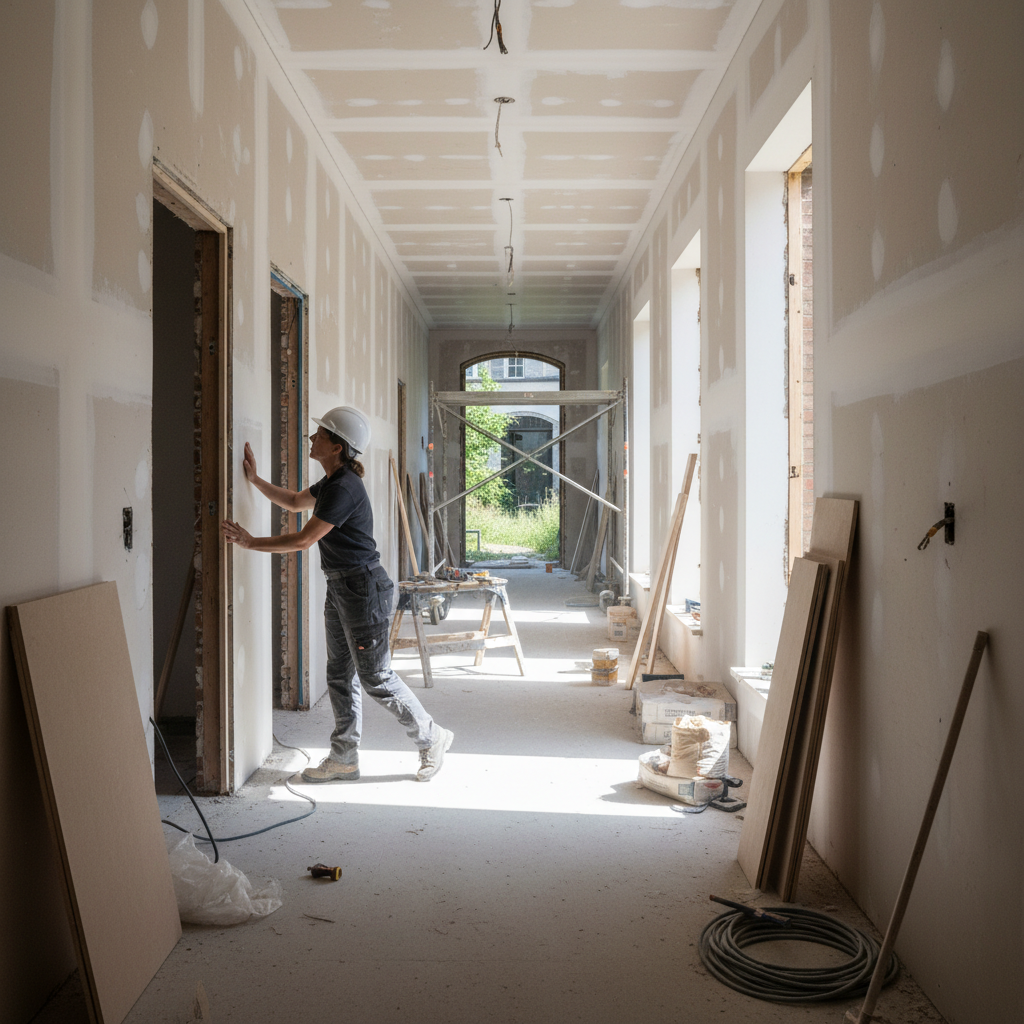
The hallway tells you
everything the listing won't.
Marcus Rivera, Managing Partner — walking a building mid-negotiation
Active Pipeline
7 buildings.
None on LoopNet.
2214 Amsterdam Ave
Washington Heights · 28 units
7.8%
Active Diligence
540 W 163rd St
Washington Heights · 36 units
8.2%
LOI Signed
881 St Nicholas Ave
Harlem · 22 units
7.4%
Under Negotiation
1204 Bushwick Ave
Bushwick · 16 units
8.9%
Active Diligence
For Accredited Investors
Stop bidding against
algorithms.
The co-op market is one of the last corners of New York real estate where relationships with board presidents matter more than speed of capital. We've spent years building those relationships so you don't have to.